

Sovereignty: Building the Service Catalog!
In my Techorama conference talk “Beyond the hyperscalers”, I explained to the audience how you could build your own cloud. It all boils down to relentless engineering. Automate whatever is possible and build a solid foundation that ties all the services together into a coherent environment. The service catalog concept is a cornerstone in the platform that you want to build.
My previous article explained the concept of the service catalog in my personal cloud. Not just a list of containers, but a description of what the platform provides and how its parts belong together.
Now let’s make that description do some work.
I already have Prometheus and Grafana running. They can tell me a lot about my infrastructure. But adding a service still means telling several tools about the same thing. Add a monitoring target here, create a dashboard panel there, copy a URL, remember which name I used last time.
We can do better than that.
Describe the service once. Generate the monitoring target and the dashboard from that same description. Let the running systems supply the actual status.
The connection matters more than the dashboard
A dashboard is a beautiful, but not the not the most interesting part. The interesting part is that the catalog entry, monitoring target and dashboard query all refer to the same service.
We will build this chain:
The catalog says what should be checked. Blackbox Exporter performs the HTTP request. Prometheus stores the result, including the service labels. Grafana queries that result using the same stable service identifier.
No portal application, database or API to build. Just configuration, a small generator and tools that already know their jobs.
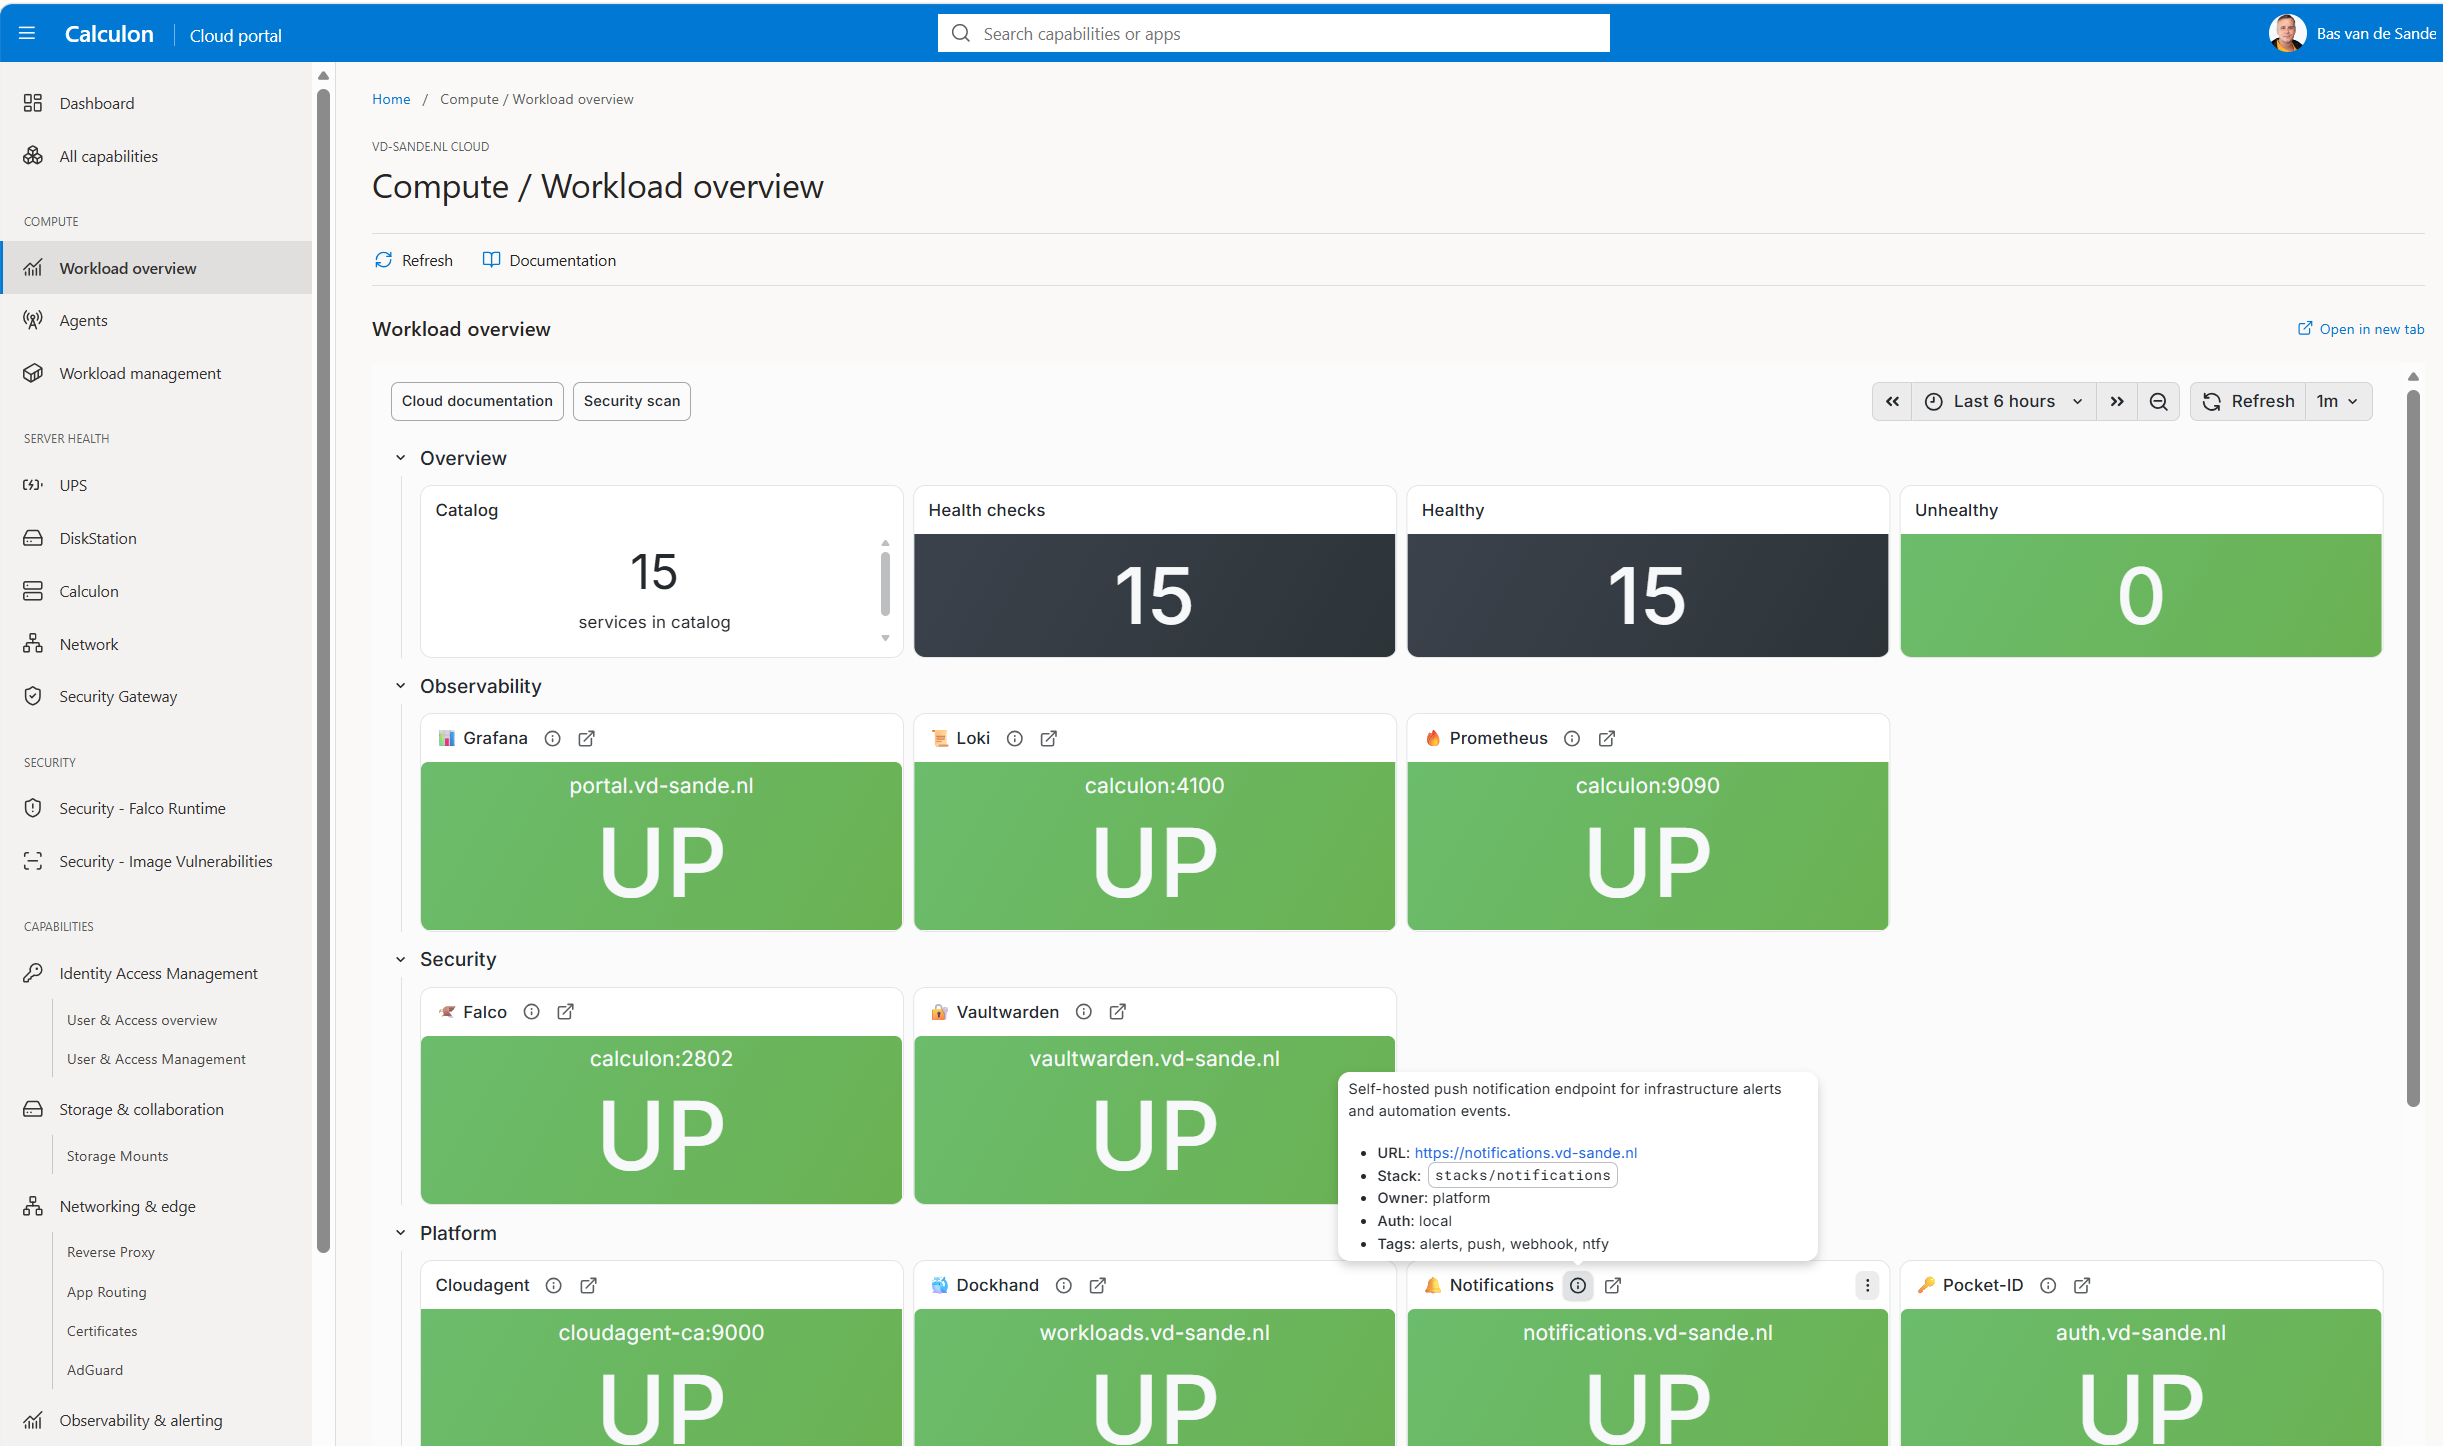
In my own infrastructure I went a bit further and I implemented a portal generator as well to get this nice Azure look-and-feel. This example runs independently from my own infrastructure and focusses on the essentials. It deliberately implements only the monitoring slice of the catalog, services and one primary capability per service. Resources, backup operations and richer relationships still belong in the broader model; they are not all HTTP targets.
Start with a small catalog
Create an empty folder and put this in catalog.yaml:
capabilities:
  applications: End-user applications

services:
  - id: demo
    name: Demo website
    capability: applications
    owner: platform
    url: http://localhost:8080
    health:
      url: http://demo:80
      module: http_2xx
The two URLs are intentionally different. The first is where I open the service in my browser. The second is what Blackbox Exporter can reach inside the Docker network. From inside a container, localhost would point back to that container, not to the demo website.
The identifier demo is the link between configuration and measurements. The display name can change without rewriting every query. The capability and owner become labels, so the relationship is available in Prometheus as well as the catalog.
Keep secrets out of this file. This is reviewed repository content, not a credential store or a public endpoint for people to submit arbitrary probe URLs.
One generator, two outputs
We will generate these files:
targets/services.json
grafana/dashboards/service-catalog.json
The first is Prometheus file discovery data. The second is a provisioned Grafana dashboard with a status panel for each service. Both come from the same input, rather than maintaining a second service inventory in Grafana.
Use Python 3.10 or newer. Put PyYAML==6.0.3 in requirements.txt (oldskool, I know 😘), then create an environment:
python3 -m venv .venv
source .venv/bin/activate
python -m pip install -r requirements.txt
These commands are for Linux or macOS. On Windows, use your Python installation to create the environment and activate it with .venv\Scripts\Activate.ps1. Keep .venv/ out of Git.
Put the following in generate_catalog.py:
import argparse
import json
from pathlib import Path
import re
import sys
from urllib.parse import urlsplit

import yaml


def text(record, field):
    value = record.get(field) if isinstance(record, dict) else None
    if not isinstance(value, str) or not value.strip():
        raise ValueError(f"Expected non-empty text for {field}")
    return value


def http_url(record, field):
    value = text(record, field)
    parsed = urlsplit(value)
    if parsed.scheme not in {"http", "https"} or not parsed.hostname:
        raise ValueError(f"Expected an HTTP(S) URL: {value}")
    if parsed.username is not None or parsed.password is not None:
        raise ValueError("Do not put credentials in catalog URLs")
    return value


def build(catalog):
    if not isinstance(catalog, dict):
        raise ValueError("The catalog must be a mapping")
    capabilities = catalog.get("capabilities")
    services = catalog.get("services")
    if not isinstance(capabilities, dict) or not capabilities:
        raise ValueError("Expected a capabilities mapping")
    for identifier in capabilities:
        text(capabilities, identifier)
    if not isinstance(services, list) or not services:
        raise ValueError("Expected a non-empty services list")

    validated = []
    identifiers = set()
    for service in services:
        identifier = text(service, "id")
        if not re.fullmatch(r"[a-z][a-z0-9-]*", identifier):
            raise ValueError(f"Invalid service id: {identifier}")
        if identifier in identifiers:
            raise ValueError(f"Duplicate service id: {identifier}")
        identifiers.add(identifier)
        for field in ("name", "owner", "capability"):
            text(service, field)
        if service["capability"] not in capabilities:
            raise ValueError(f"Unknown capability: {service['capability']}")
        http_url(service, "url")
        health = service.get("health")
        http_url(health, "url")
        if text(health, "module") != "http_2xx":
            raise ValueError("This example only configures the http_2xx module")
        validated.append(service)

    targets, panels = [], []
    for position, service in enumerate(sorted(validated, key=lambda item: item["id"])):
        identifier = service["id"]
        targets.append({
            "targets": [service["health"]["url"]],
            "labels": {
                "service": identifier,
                "service_name": service["name"],
                "capability": service["capability"],
                "owner": service["owner"],
                "__param_module": service["health"]["module"],
            },
        })
        panels.append({
            "id": position + 1,
            "type": "stat",
            "title": f"{capabilities[service['capability']]} / {service['name']}",
            "gridPos": {"h": 5, "w": 8, "x": (position % 3) * 8, "y": (position // 3) * 5},
            "datasource": {"type": "prometheus", "uid": "prometheus_ds"},
            "targets": [{
                "refId": "A",
                "expr": f'probe_success{{job="service_health",service="{identifier}"}}',
                "instant": True,
            }],
            "fieldConfig": {"defaults": {
                "noValue": "NO DATA",
                "mappings": [{"type": "value", "options": {
                    "0": {"text": "DOWN", "color": "red"},
                    "1": {"text": "UP", "color": "green"},
                }}],
                "thresholds": {"mode": "absolute", "steps": [
                    {"color": "red", "value": None},
                    {"color": "green", "value": 1},
                ]},
            }, "overrides": []},
            "options": {"colorMode": "background", "reduceOptions": {
                "calcs": ["lastNotNull"], "fields": "", "values": False,
            }},
            "links": [{"title": "Open service", "url": service["url"], "targetBlank": True}],
        })

    dashboard = {
        "uid": "service-catalog", "title": "Service Catalog",
        "schemaVersion": 39, "version": 1, "editable": False,
        "timezone": "browser", "refresh": "15s",
        "time": {"from": "now-1h", "to": "now"}, "panels": panels,
    }
    return {
        "targets/services.json": targets,
        "grafana/dashboards/service-catalog.json": dashboard,
    }


def main():
    parser = argparse.ArgumentParser()
    parser.add_argument("--check", action="store_true")
    args = parser.parse_args()
    root = Path(__file__).resolve().parent
    try:
        catalog = yaml.safe_load((root / "catalog.yaml").read_text(encoding="utf-8"))
        artifacts = build(catalog)
        for relative, content in artifacts.items():
            output = root / relative
            expected = json.dumps(content, indent=2, ensure_ascii=True) + "\n"
            if args.check:
                if not output.exists() or output.read_text(encoding="utf-8") != expected:
                    raise ValueError(f"Missing or outdated: {relative}")
            else:
                output.parent.mkdir(parents=True, exist_ok=True)
                output.write_text(expected, encoding="utf-8")
        print("Catalog artifacts checked" if args.check else "Catalog artifacts generated")
    except (OSError, UnicodeError, ValueError, yaml.YAMLError) as error:
        print(f"ERROR: {error}", file=sys.stderr)
        return 1
    return 0


if __name__ == "__main__":
    sys.exit(main())
There is a bit of Grafana JSON in there. That is exactly the configuration I do not want to repeat by hand for every service.
The generator checks required fields, unique service identifiers, capability references and the supported probe module before writing either artifact. It is intentionally not a complete schema validator. For example, it does not reject every unused field or prove that a URL is reachable.
Output is sorted by service identifier and has no timestamps or network lookups. The same input produces the same files, which makes the Git diff and the drift check meaningful. Panel numbers are assigned from that sorted list; they are not permanent identifiers for external panel links. The dashboard UID and service labels are stable.
Run it now:
python generate_catalog.py
Tell Prometheus how to probe
Create prometheus.yml:
global:
  scrape_interval: 15s
  scrape_timeout: 10s

scrape_configs:
  - job_name: service_health
    metrics_path: /probe
    file_sd_configs:
      - files:
          - /etc/prometheus/targets/services.json
        refresh_interval: 15s
    relabel_configs:
      - source_labels: [__address__]
        target_label: __param_target
      - source_labels: [__param_target]
        target_label: instance
      - target_label: __address__
        replacement: blackbox:9115
The generated target is the website URL, but Prometheus does not scrape that website for metrics. Relabeling puts the URL into the target query parameter and sends the scrape to Blackbox Exporter instead. The generated __param_module label selects its probe module.
Blackbox Exporter performs the request and returns metrics such as probe_success and probe_duration_seconds. The normal labels, including service, capability and owner, remain attached to those measurements. The special __param_... labels are request configuration, not stored business labels.
Create blackbox.yml with the module used by the catalog:
modules:
  http_2xx:
    prober: http
    timeout: 5s
For HTTPS targets, certificate validation stays enabled. Do not solve a trust problem by disabling TLS verification. The local demo uses HTTP inside its Docker network to keep certificate management outside this example.
Give Grafana the same vocabulary
Create grafana/provisioning/datasources/prometheus.yml:
apiVersion: 1
datasources:
  - name: Prometheus
    type: prometheus
    uid: prometheus_ds
    access: proxy
    url: http://prometheus:9090
    isDefault: true
    editable: false
The fixed datasource UID matches the generated panels. Grafana reaches Prometheus over the Docker network; this is not the address used by your browser.
Create grafana/provisioning/dashboards/catalog.yml:
apiVersion: 1
providers:
  - name: service-catalog
    type: file
    updateIntervalSeconds: 10
    allowUiUpdates: false
    options:
      path: /var/lib/grafana/catalog-dashboards
The provider loads the generated dashboard from disk. Its panel query looks like this:
probe_success{job="service_health", service="demo"}
That demo is the identifier from the catalog. Not a manually maintained mapping, not a guess based on a display name.
The same metadata makes a capability-level query possible:
sum by (capability) (probe_success{job="service_health"} == bool 0)
This counts failing probes among the reported series per capability. It does not prove that the entire capability works, and missing series are not counted as failures. Backup correctness, authentication and an actual file upload require different checks. A green HTTP probe is useful evidence, not a complete acceptance test.
Run the small version
Put this in compose.yaml beside the catalog and generator:
services:
  demo:
    image: caddy:2.10.2
    ports:
      - "127.0.0.1:8080:80"

  blackbox:
    image: prom/blackbox-exporter:v0.27.0
    command: ["--config.file=/etc/blackbox/blackbox.yml"]
    volumes:
      - ./blackbox.yml:/etc/blackbox/blackbox.yml:ro

  prometheus:
    image: prom/prometheus:v3.5.0
    ports:
      - "127.0.0.1:9090:9090"
    volumes:
      - ./prometheus.yml:/etc/prometheus/prometheus.yml:ro
      - ./targets:/etc/prometheus/targets:ro
      - prometheus-data:/prometheus

  grafana:
    image: grafana/grafana:12.1.1
    environment:
      GF_SECURITY_ADMIN_PASSWORD: local-demo-change-me
    ports:
      - "127.0.0.1:3000:3000"
    volumes:
      - ./grafana/provisioning:/etc/grafana/provisioning:ro
      - ./grafana/dashboards:/var/lib/grafana/catalog-dashboards:ro
      - grafana-data:/var/lib/grafana

volumes:
  prometheus-data:
  grafana-data:
These are explicit example versions, not a claim that they are the latest patched releases. Review image versions before using this beyond the demo, and apply your normal update and digest-pinning policy.
The published ports bind to loopback only. Blackbox Exporter is not published at all. The Grafana password is a local demonstration value, not a production secret-management pattern. If these ports are already in use, change the host-side ports and adjust the browser URL in the catalog when changing port 8080.
Start the stack after generating the artifacts and creating the configuration files:
docker compose up -d
Open http://localhost:9090 and query probe_success{job="service_health"}. Once the first successful scrape arrives, you should see value 1 with service="demo", capability="applications" and owner="platform".
Then open http://localhost:3000, sign in as admin with local-demo-change-me and open the Service Catalog dashboard. The demo panel should show UP. Grafana can ask you to change the password; an existing Grafana data volume retains its existing credentials.
Break something on purpose
Stop the demo website, leaving the monitoring stack running:
docker compose stop demo
After the next probe and dashboard refresh, the panel should show DOWN. Start it again with docker compose start demo and watch it recover.
This is also where an important distinction becomes visible:
uptells you whether Prometheus successfully scraped the Blackbox probe endpoint.probe_successtells you whether the requested website probe succeeded.
The exporter can successfully return a failed probe. In that case up is 1, while probe_success is 0. Using up as website availability would produce a very reassuring dashboard for a website that is not running. Oh man…
If the exporter itself becomes unreachable, the probe series can become stale and disappear. NO DATA is not UP. The panel uses an instant query to avoid presenting an old successful sample as the current result, but there can still be a staleness delay. In a real setup, monitor exporter availability and missing probe data as well as failed probes.
Add a service without editing the dashboard
Now add another service entry with a unique identifier, an existing capability and a real endpoint reachable from Blackbox Exporter. Deploy the application separately; the catalog does not do that job.
Run the generator again. It adds both the Prometheus target and the Grafana panel.
Prometheus refreshes its discovery file automatically. Grafana’s provider picks up the dashboard file. Because we mount the generated directories rather than individual generated files, replacing artifacts inside those directories remains visible to the containers. Allow time for discovery, the next scrape, dashboard provisioning and the browser refresh.
No edits to the scrape job. No hand-written dashboard JSON for the new service. No application deployment triggered by adding metadata.
That is the connection I was looking for.
Keep the outputs honest
Commit the catalog, generator, configuration and generated artifacts together. Check drift with:
python generate_catalog.py --check
This validates the catalog and compares both files against the expected output without writing anything. A missing or outdated artifact produces exit status 1. Try changing the display name without regenerating: the check should fail because the dashboard and target labels no longer match their source.
In CI, install the requirements and run this check after checkout and Python setup. Do not generate first and check afterwards; that would hide the drift you wanted to detect.
The check does not need access to the actual services. It checks consistency of configuration, while Prometheus checks the running endpoints. Those are different responsibilities, and I want both.
Wrap up
We have not built another monitoring platform. We have connected the description of our platform to the monitoring tools we already use. The catalog provides identity and context. Blackbox Exporter performs a check. Prometheus stores the evidence with the right labels. Grafana presents it using queries derived from the same source. The result is more than a dashboard with green squares. It is one less place where the architecture can quietly drift away from reality.
One service definition. Two generated artifacts. A shared vocabulary all the way through.