Sovereignty: Who is monitoring my cloud?
Chaos, Chaos and Chaos. That’s how I want to describe Last week. How stupid could I be, neglecting maintenance on my servers. What possibly could go wrong!
I still get angry with myself over this rookie mistake. No matter what platform, there is always systems maintenance that needs to be done in the background. On the other hand, as being cloud native, this was something to be expected. On the hyperscalers, maintenance is done in the background, tucked away from the end user.
Running your own cloud, means that you have to keep it up-and-running. Lesson learned! Oh man…
After the meltdown
After that little meltdown, I looked at what I actually had running. I had a collection of four machines; the Lenovo server, the Synology storage, a UPS and a network. All of them had their own metrics and logs. Isolated, tucked away in separate tools, and definitely not easy to access.
In Azure we always use a centralized Log Analytics Workspace to collect the logs and metrics. For my cloud I was looking for a similar solution. Over the years I had heard about Prometheus/Grafana, some clients even used it. But to me it was an unknown piece of wizardry.
Possible observability stacks
Anyway, I started a little search for a centralized logging/metrics solution that would suit my personal cloud. Soon the following alternatives popped up.
Prometheus + Grafana
Prometheus handles metrics in a simple and predictable way. Grafana gives you dashboards and alerting without turning it into a full enterprise project. It’s lightweight, modular, and easy to reason about.
Main drawback: you have to assemble the pieces yourself; it’s not a single integrated product.
ELK / OpenSearch
Elasticsearch, Logstash and Kibana (or OpenSearch) are very strong in logs and full‑text search, especially when you need deep querying or large log volumes. Metrics are possible, but it’s built around logs first.
Main drawback: it’s heavy — high RAM usage, high CPU usage, and more operational overhead.
VictoriaMetrics + Grafana
VictoriaMetrics (VM)is a fast, efficient time‑series database that stores Prometheus‑style metrics with lower resource usage and longer retention. With Grafana on top, the workflow stays familiar.
Main drawback: VM only replaces the storage layer, but is missing log scrapers. It doesn’t solve the whole observability picture.
There were many more alternatives such as Zabbix, Netdata, Datadog, in fact too much to dive into the details. As I mentioned before I had seen Prometheus/Grafana before so I chose to try that route.
Implement the observability stack
The great thing of running a containerized enviroment, is that you easily can try if something suits you. If you don’t like, just remove the stack and try the next one. As Prometheus and Grafana are widely used, it wasn’t that hard to come up with a good starter docker-compose. After a nice AI conversation I learned that for optimum performance I needed to make volume mappings on the docker host and not on the Synology. In order to keep the amount of data small, I narrowed it down to 15 days of retention. For alerting I quickly set up a gmail account. I need to move this later to my future mail server.
The main observability stack has four components:
- Prometheus
Collects metrics in a simple, predictable way without pretending to be anything more. - Grafana
Shows your metrics and logs in dashboards you can actually read, plus alerting. - Loki
Stores logs efficiently. - Promtail
Ships logs to Loki.
The observability stack is described in the docker-compose below:
services:
  prometheus:
    image: prom/prometheus:latest
    container_name: prometheus
    user: "0"
    volumes:
      - ./prometheus/prometheus.yml:/etc/prometheus/prometheus.yml
      - ./prometheus/rules:/etc/prometheus/rules
      - ./storage/prometheus:/prometheus
    command:
      - "--config.file=/etc/prometheus/prometheus.yml"
      - "--storage.tsdb.retention.time=15d"
    ports:
      - "9090:9090"
    extra_hosts:
      - "host.docker.internal:host-gateway"
    networks:
      - observability_network
    restart: unless-stopped

  grafana:
    image: grafana/grafana:latest
    container_name: grafana
    user: "0"
    environment:
      - GF_DASHBOARDS_DEFAULT_HOME_DASHBOARD_PATH=/etc/grafana/provisioning/dashboards/home.json
      # SMTP / alerting
      - GF_SMTP_ENABLED=true
      - GF_SMTP_HOST=smtp.gmail.com:587
      - GF_SMTP_USER=someone@gmail.com
      - GF_SMTP_PASSWORD=${GF_SMTP_PASSWORD}
      - GF_SMTP_FROM_ADDRESS=someone@gmail.com
      - GF_SMTP_FROM_NAME=Grafana Alerts
    ports:
      - "4000:3000"
    volumes:
      - ./storage/grafana:/var/lib/grafana
      - ./grafana/provisioning:/etc/grafana/provisioning
    networks:
      - observability_network
    restart: unless-stopped

  loki:
    image: grafana/loki:3.5.0
    container_name: loki
    user: "0"
    volumes:
      - ./loki/loki.yml:/etc/loki/loki.yml
      - ./storage/loki:/loki
    command: -config.file=/etc/loki/loki.yml
    ports:
      - "4100:3100"
    networks:
      - observability_network
    restart: unless-stopped

  promtail:
    image: grafana/promtail:2.9.0
    container_name: promtail
    volumes:
      - ./promtail/promtail.yml:/etc/promtail/promtail.yml
      - /var/log:/var/log:ro
      - /var/lib/docker/containers:/var/lib/docker/containers:ro
    command: -config.file=/etc/promtail/promtail.yml
    networks:
      - observability_network
    restart: unless-stopped

networks:
  observability_network:
    name: observability_network
And is accompied by a simple .env file in which I stored the generated app password for Google.
# Gmail App Password voor Grafana SMTP alerting
# Maak een App Password aan via: https://myaccount.google.com/apppasswords
# (Vereist 2-staps-verificatie op je Google account)
GF_SMTP_PASSWORD=FILL_IN_YOUR_GMAIL_APP_PASSWORD
What about collecting data from all over?
In order to collect the data, you need to add exporters for all the systems that you want to connect. In this docker-compose, my Lenovo server, UPS and Synology are connected to the central observability platform.
services:
  node_exporter:
    image: prom/node-exporter:latest
    container_name: node_exporter
    network_mode: host
    pid: host
    volumes:
      - /:/host:ro,rslave
    command:
      - "--path.rootfs=/host"
    restart: unless-stopped

  blackbox_exporter:
    image: prom/blackbox-exporter:latest
    container_name: blackbox_exporter
    cap_add:
      - NET_RAW
    extra_hosts:
      - "host.docker.internal:host-gateway"
    volumes:
      - ./blackbox/blackbox.yml:/etc/blackbox_exporter/config.yml
    networks:
      - observability_network
    restart: unless-stopped

  nut_exporter:
    image: druggeri/nut_exporter:latest
    container_name: nut_exporter
    environment:
      NUT_EXPORTER_SERVER: "192.168.3.200"
      NUT_EXPORTER_SERVERPORT: "3493"
      NUT_EXPORTER_USERNAME: "UPS-USERNAME"
      NUT_EXPORTER_PASSWORD: "${NUT_PASSWORD}"
      NUT_EXPORTER_VARIABLES: "battery.charge,battery.runtime,ups.load,battery.voltage,input.voltage,ups.status,ups.realpower.nominal"
    networks:
      - observability_network
    restart: unless-stopped

  synology_exporter:
    image: registry.vd-sande.nl/synology-exporter:latest
    container_name: synology_exporter
    volumes:
      - ./synology_exporter/targets.json:/app/targets.json
    networks:
      - observability_network
    restart: unless-stopped

networks:
  observability_network:
    external: true
    name: observability_network
Set it up the way you want it
Before the docker-compose files can be installed on the docker host, there are some configurations that you need to do. To give an impression, this is the folder structure that I have on the docker host, that enables a number of dashboards, alerts and exports
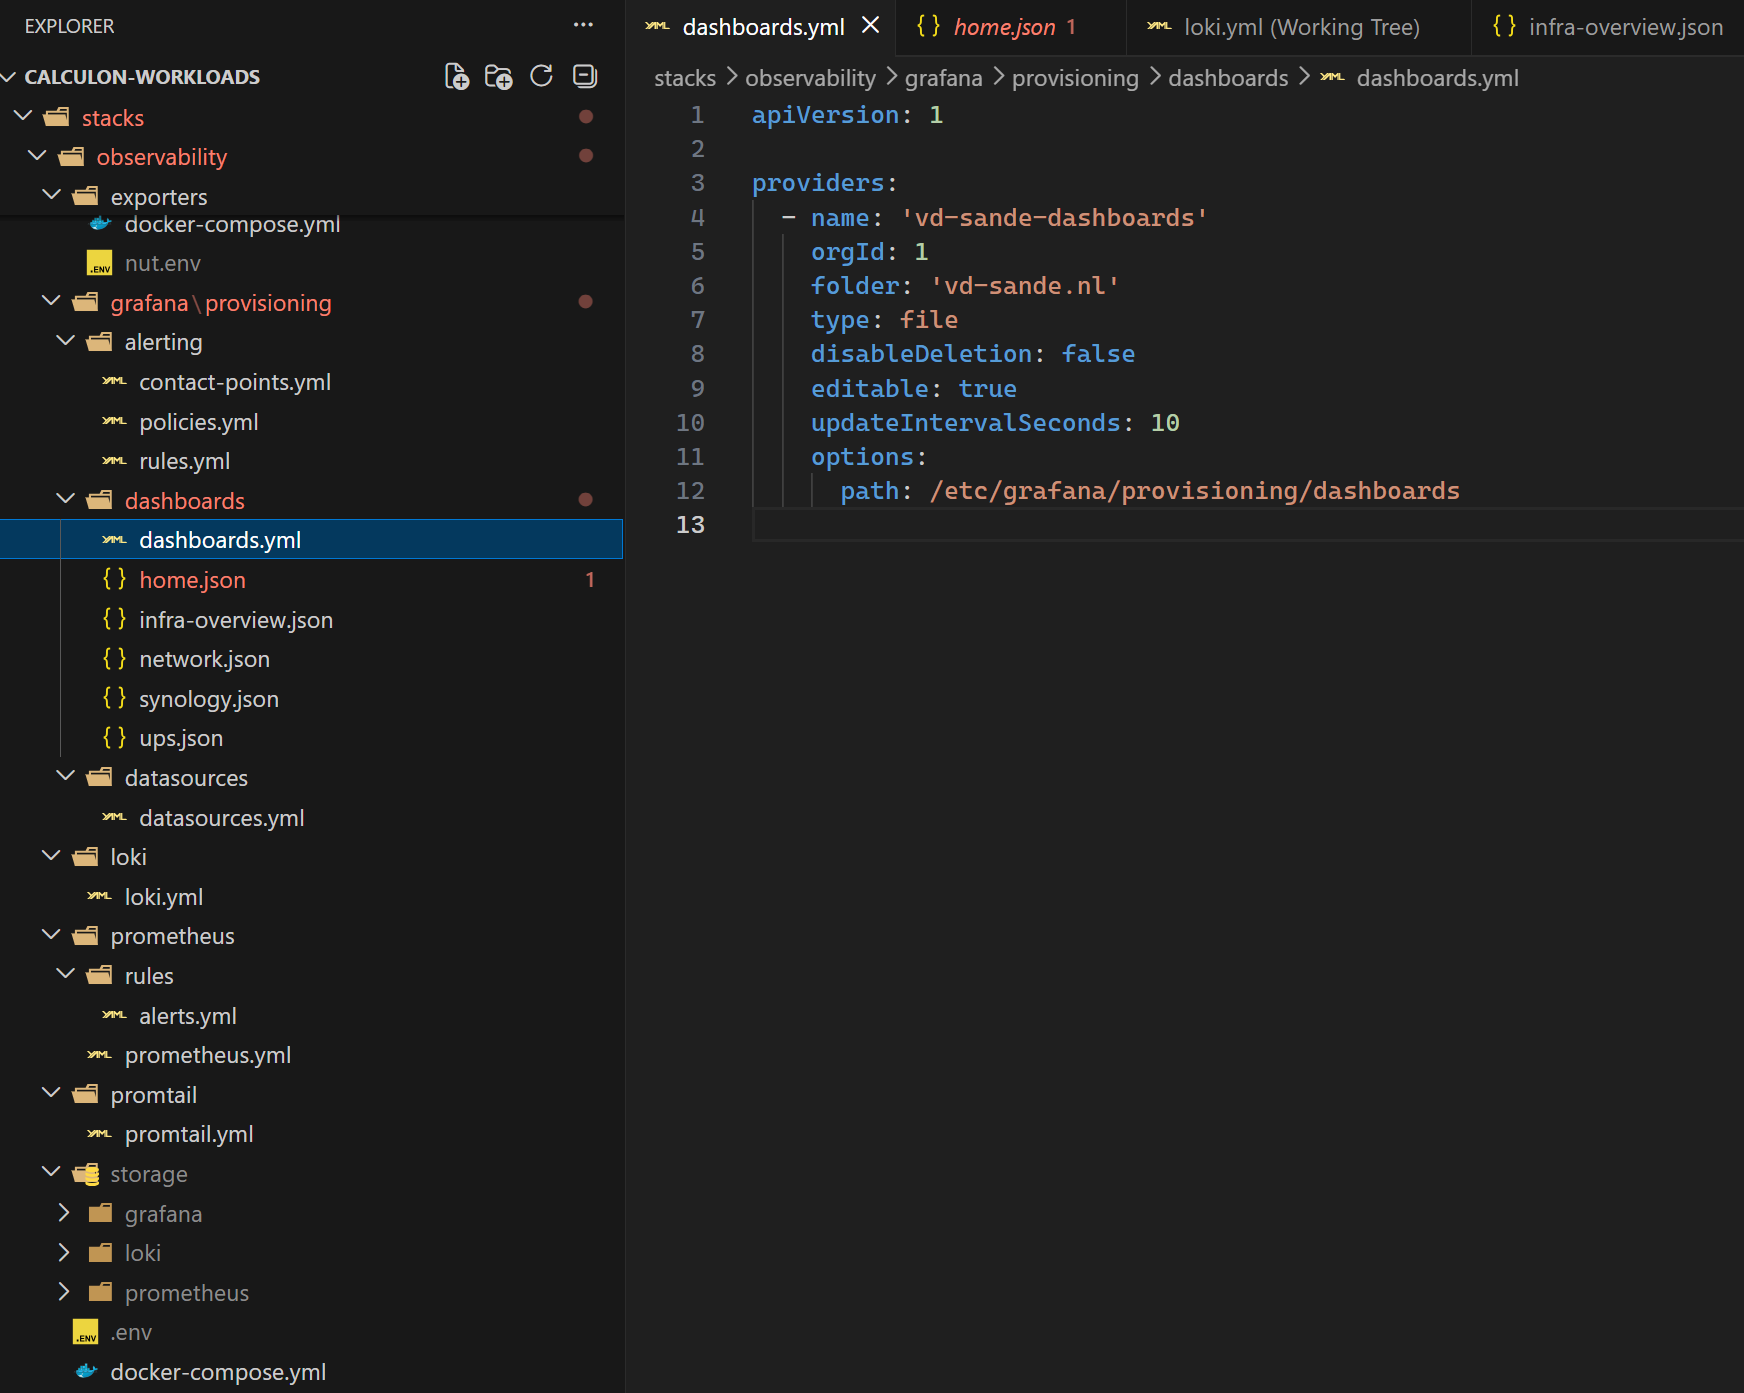
What helped me, was asking AI to generate the json and yaml files that I needed inside the particular folders. From there on I tweaked them according to my needs.
In the end I automated the complete deployment in a Gitea workflow.
name: Deploy Observability

on:
  push:
    branches:
      - main
    paths:
      - 'stacks/observability/**'
  workflow_dispatch:


jobs:
  deploy:
    runs-on: build-image
    env:
      folder: observability
      dest: /srv/docker/stacks/apps/observability

    steps:
      - name: Checkout code
        uses: actions/checkout@v4

      - name: Prepare SSH key
        run: |
          mkdir -p ~/.ssh
          echo "${{ secrets.DEPLOY_KEY }}" > ~/.ssh/id_rsa
          chmod 600 ~/.ssh/id_rsa
          ssh-keyscan -H "${{ secrets.DEPLOY_HOST }}" >> ~/.ssh/known_hosts

      - name: Create directory structure on server
        run: |
          ssh ${{ secrets.DEPLOY_USER }}@${{ secrets.DEPLOY_HOST }} "
            mkdir -p ${{ env.dest }}/exporters
            mkdir -p ${{ env.dest }}/grafana/provisioning/dashboards
            mkdir -p ${{ env.dest }}/grafana/provisioning/datasources
            mkdir -p ${{ env.dest }}/loki
            mkdir -p ${{ env.dest }}/prometheus/rules
            mkdir -p ${{ env.dest }}/promtail
            mkdir -p ${{ env.dest }}/storage/grafana
            mkdir -p ${{ env.dest }}/storage/loki
            mkdir -p ${{ env.dest }}/storage/prometheus
            mkdir -p ${{ env.dest }}/exporters/blackbox
            mkdir -p ${{ env.dest }}/exporters/synology_exporter
          "

      - name: Write secret environment files on server
        run: |
          ssh ${{ secrets.DEPLOY_USER }}@${{ secrets.DEPLOY_HOST }} \
            "echo 'NUT_PASSWORD=${{ secrets.NUT_PASSWORD }}' > ${{ env.dest }}/exporters/.env"

      - name: Copy files to server
        run: |
          apt-get update
          command -v rsync >/dev/null 2>&1 || apt-get install -y -qq rsync || apk add --no-cache rsync
          rsync -avz --exclude 'storage/' --exclude 'exporters/synology_exporter/targets.json' \
            -e "ssh -i ~/.ssh/id_rsa" \
            stacks/${{ env.folder }}/ \
            ${{ secrets.DEPLOY_USER }}@${{ secrets.DEPLOY_HOST }}:${{ env.dest }}/

      - name: Build and push synology-exporter image
        run: |
          echo "${{ secrets.REGISTRY_PASSWORD }}" | docker login registry.vd-sande.nl -u "${{ secrets.REGISTRY_USERNAME }}" --password-stdin
          docker build -t registry.vd-sande.nl/synology-exporter:latest stacks/${{ env.folder }}/exporters/synology_exporter/
          docker push registry.vd-sande.nl/synology-exporter:latest

      - name: Write synology targets on server
        env:
          SYNOLOGY_PASS: ${{ secrets.SYNOLOGY_MONITOR_PASSWORD }}
        run: |
          printf '[{"host":"192.168.3.200","port":5000,"username":"monitor","password":"%s","device_token":null}]' \
            "$SYNOLOGY_PASS" | \
            ssh ${{ secrets.DEPLOY_USER }}@${{ secrets.DEPLOY_HOST }} \
            "cat > ${{ env.dest }}/exporters/synology_exporter/targets.json"

      - name: Restart observability stack
        run: |
          ssh -tt ${{ secrets.DEPLOY_USER }}@${{ secrets.DEPLOY_HOST }} "bash -lc '
            cd ${{ env.dest }}
            echo \"${{ secrets.REGISTRY_PASSWORD }}\" | docker login registry.vd-sande.nl -u \"${{ secrets.REGISTRY_USERNAME }}\" --password-stdin
            docker compose pull
            docker compose up -d
            docker compose restart prometheus
          '"

      - name: Restart exporters stack
        run: |
          ssh -tt ${{ secrets.DEPLOY_USER }}@${{ secrets.DEPLOY_HOST }} "bash -lc '
            cd ${{ env.dest }}/exporters
            echo \"${{ secrets.REGISTRY_PASSWORD }}\" | docker login registry.vd-sande.nl -u \"${{ secrets.REGISTRY_USERNAME }}\" --password-stdin
            docker compose pull
            docker compose up -d
          '"
Final thoughts
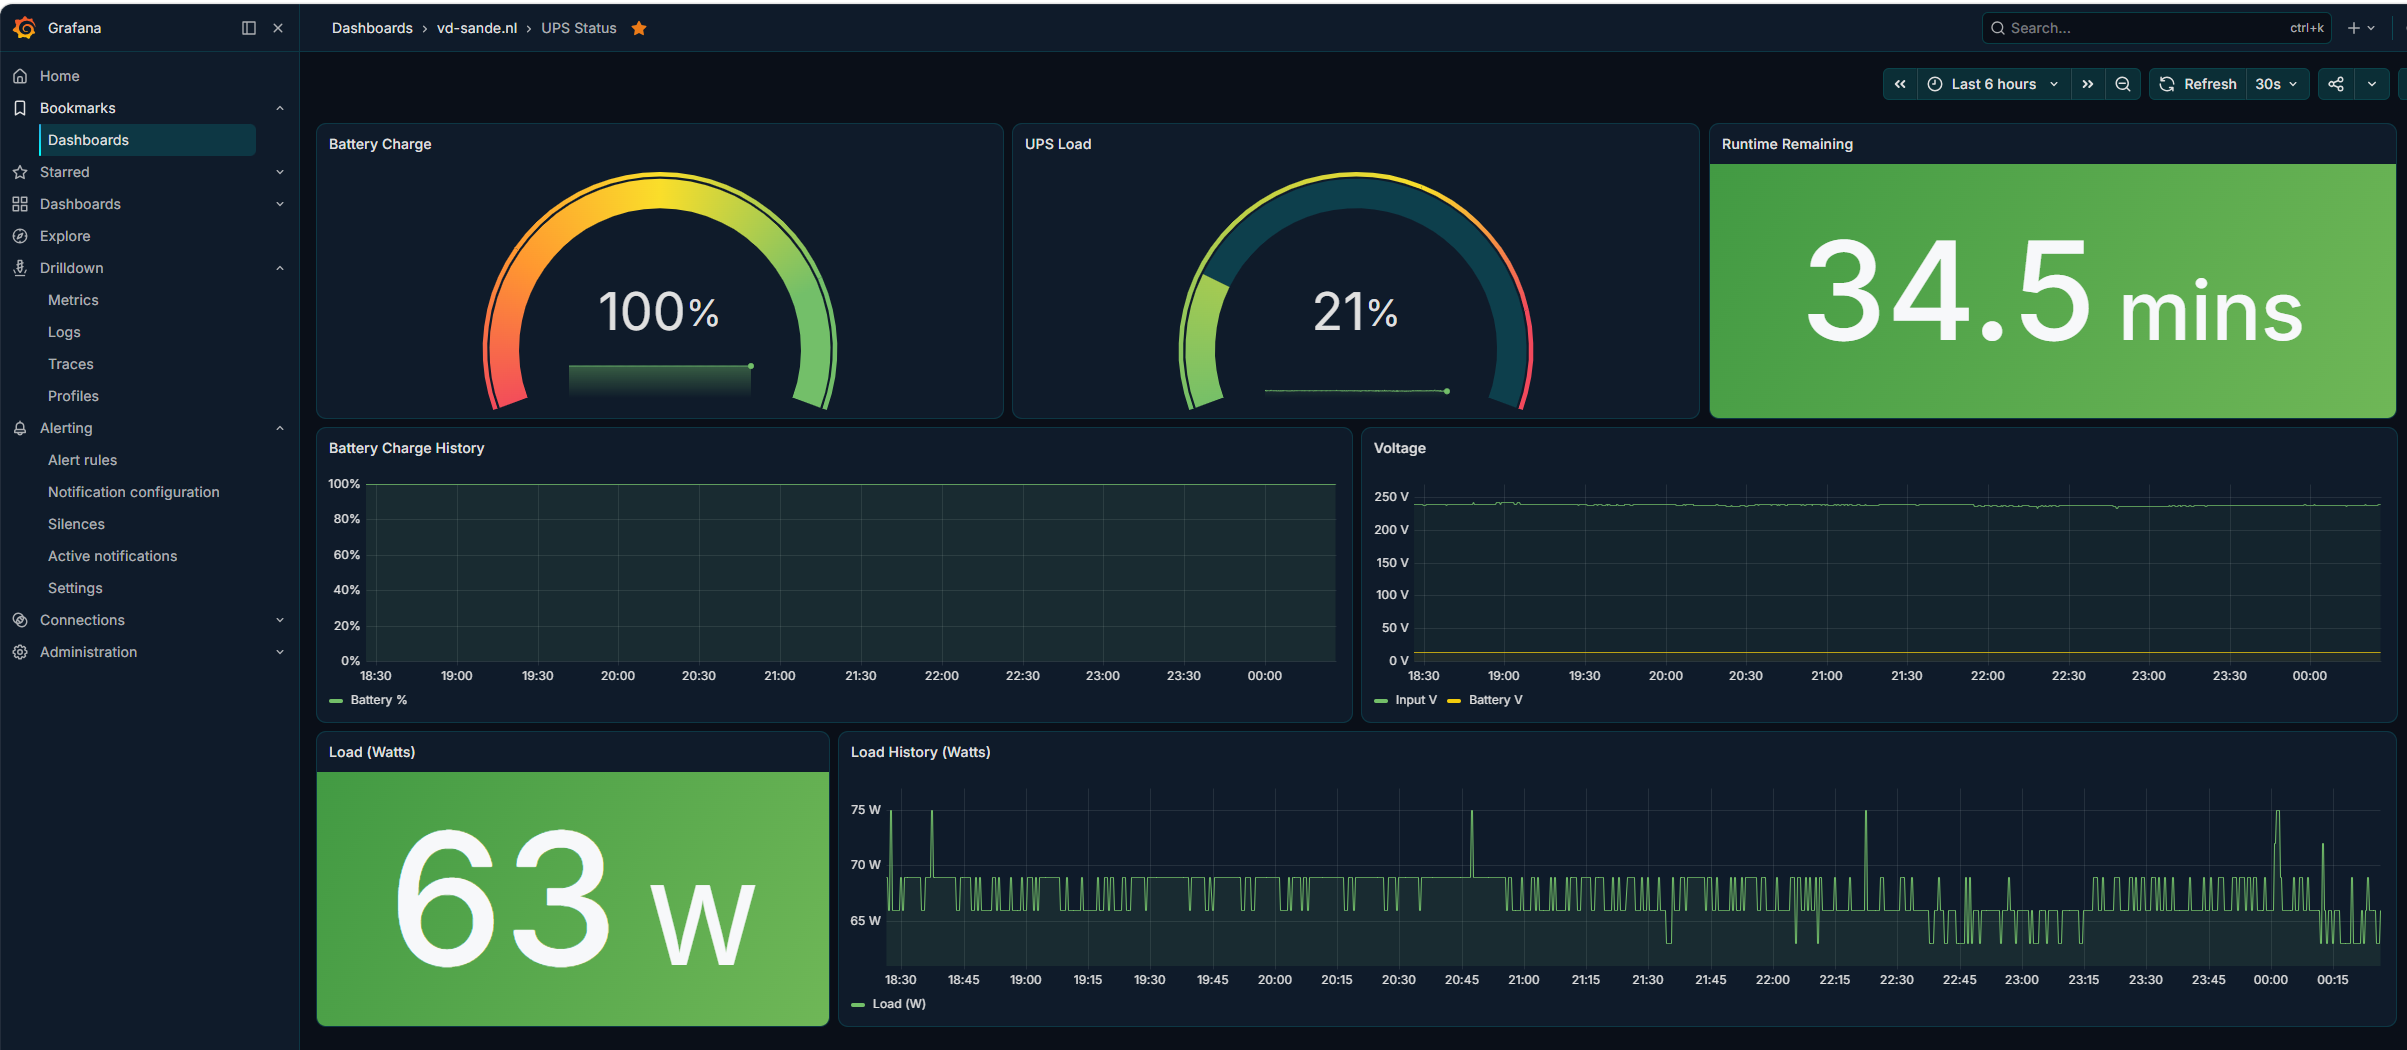
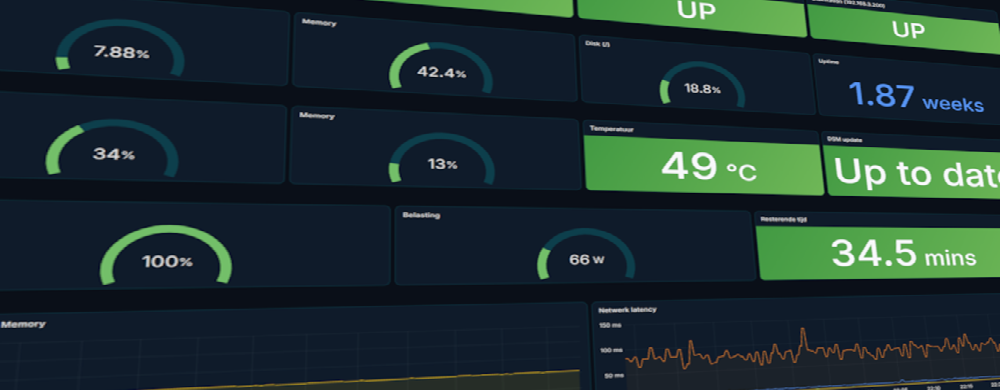
Another job fixed, my personal cloud is being monitored 24/7. Metrics and logs flow into Prometheus, Grafana displays them nicely and handles the alerts. My next job is implementing webhooks to start automated tasks in case alerts are triggered.
The sovereignty project that started as a small experiment is growing up fast. Every week I’m surprised by how far you can push simple, energy‑efficient office hardware. My entire cloud runs on 63 watts, basically the power draw of an old light bulb. Amazing!